Track AI usage
See how many AI tokens your team and public site visitors consume, by time range, workspace, project and surface.
Use the Usage page to see how many AI tokens your workspace consumes and where they go. The page separates tokens your team spends in the editor and admin tools from tokens that public visitors spend when they ask your site's assistant, so you can plan capacity and spot unexpected spikes before you reach your plan's allowance.
Before you begin
- Access: Sign in to Doxbrix and belong to a workspace. The page shows usage for the workspaces and projects you belong to.
- AI activity: Charts fill in after someone uses an AI feature or a reader asks the site assistant. Until then, panels show messages such as No activity recorded yet.
Team and visitor usage
A token is the unit AI models use to measure text they read and write. Doxbrix counts input and output tokens for every AI request and splits them into two groups:
| Group | Card | Includes |
|---|---|---|
| Team | Team Usage, badge Internal | Work by signed-in members: Editor AI, AI Writer & Admin, Workspace Assistant and Agent Automation, plus assistant questions asked while signed in |
| Visitors | Visitor Usage, badge Public | Questions anonymous readers ask the Site Assistant on published sites |
Your plan sets a monthly token allowance for the workspace:
| Plan | Monthly tokens |
|---|---|
| Free | 100,000 |
| Starter | 1,000,000 |
| Pro | 5,000,000 |
| Business | 20,000,000 |
For all plan limits and AI packs, see Plans and limits reference.
Review your AI usage
In the left sidebar, select Usage, or select View usage on the dashboard's AI token usage card. The Usage page opens at /usage on the All range and shows AI token usage across your team and public site visitors.
The summary row shows four cards:
- Team Usage: team tokens, with Requests and Avg / req (average tokens per request).
- Visitor Usage: visitor tokens, with Questions and Avg / req.
- Total tokens: the sum across all surfaces.
- Total requests: all requests, split into team and visitor counts.
Below the cards, Daily token trend charts team and visitor tokens for each day, and Token split shows each group's share together with Quick insights: Top public project, Active team members and Busiest day.
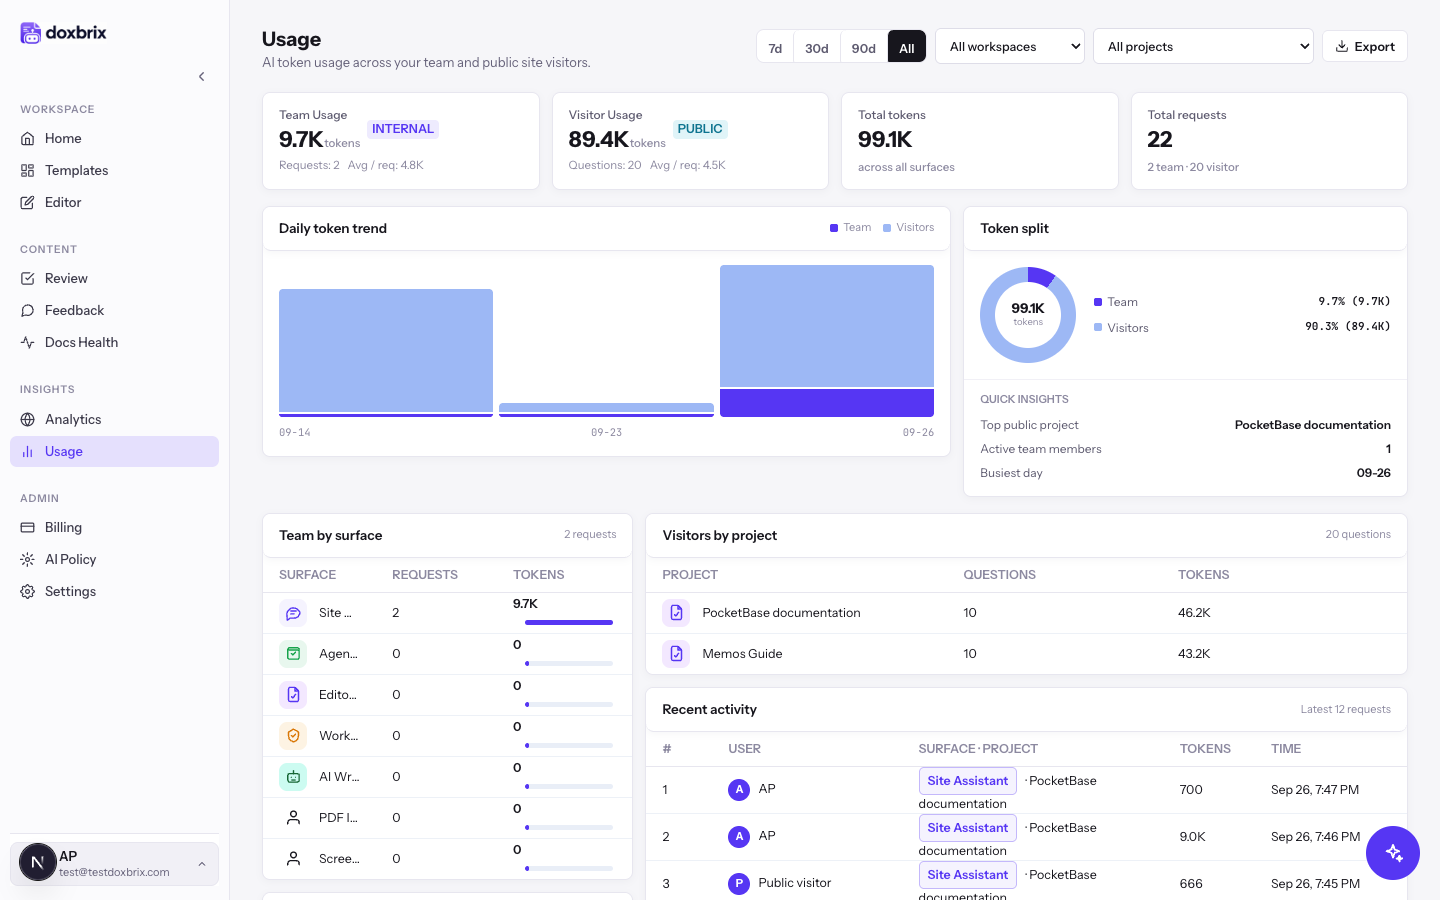
Select 7d to show the last seven days. The cards, charts and tables recalculate for that period. In this example, visitor tokens drop from 89.4K for all time to 46.2K for the last week, while team tokens stay at 9.7K because all team activity happened that week.
Select 30d or 90d for longer periods, or All to return to every recorded request.
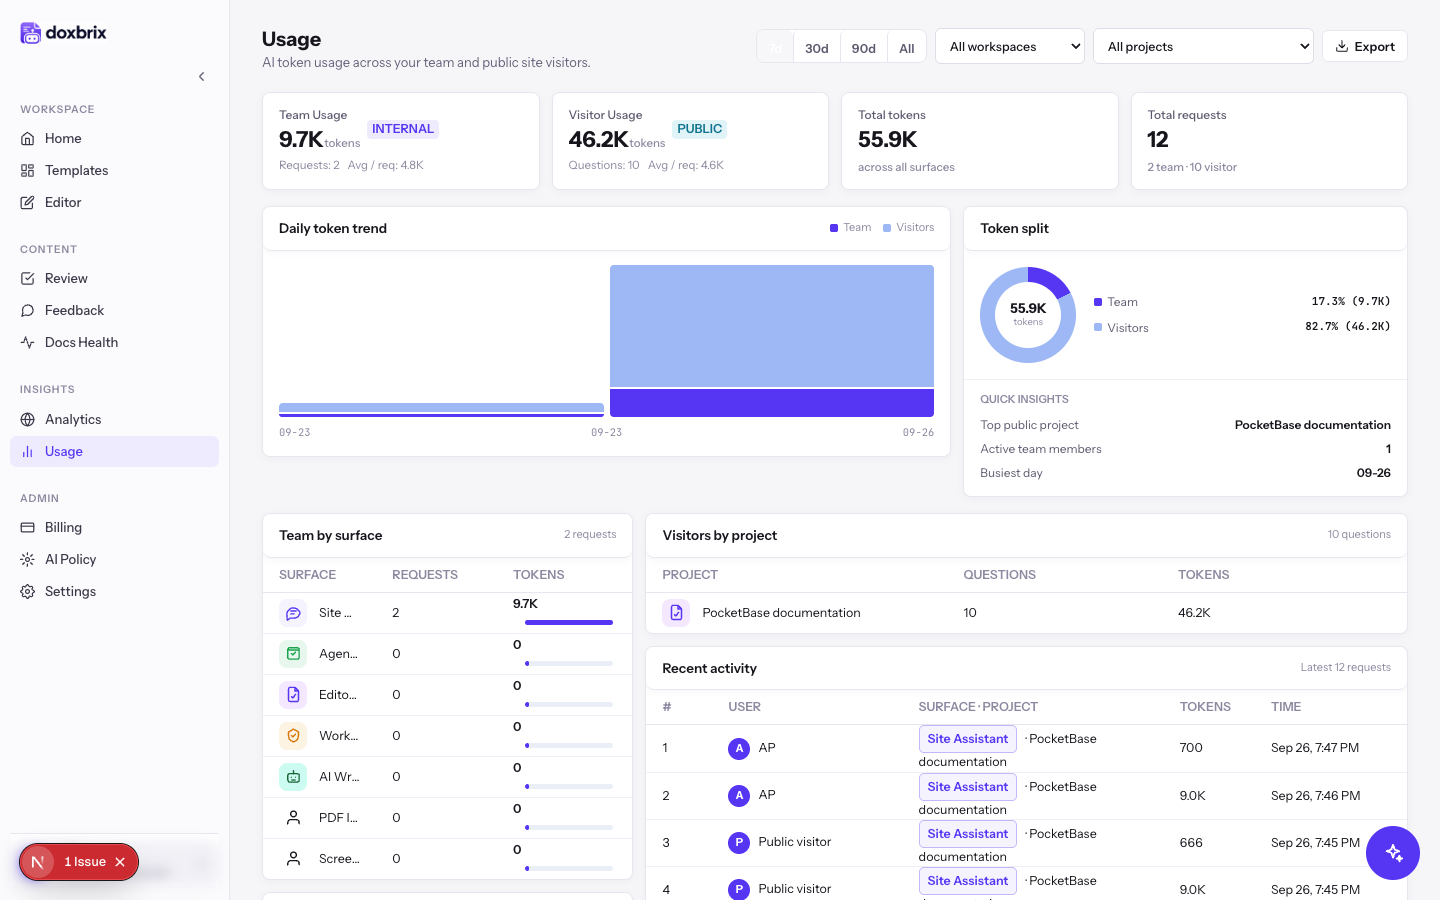
If you belong to more than one workspace, open the Workspace filter list and choose one. The list starts at All workspaces. Changing the workspace resets the project list to All projects.
Open the Project filter list, which shows All projects by default. It lists every project in the selected workspaces, for example Memos Guide and PocketBase documentation. The list is unavailable when there are no projects to choose from.
Choose PocketBase documentation. The page now shows only that project's usage. Visitors by project lists the project's questions and tokens.
If the totals match the unfiltered view, all usage in the range came from this project.
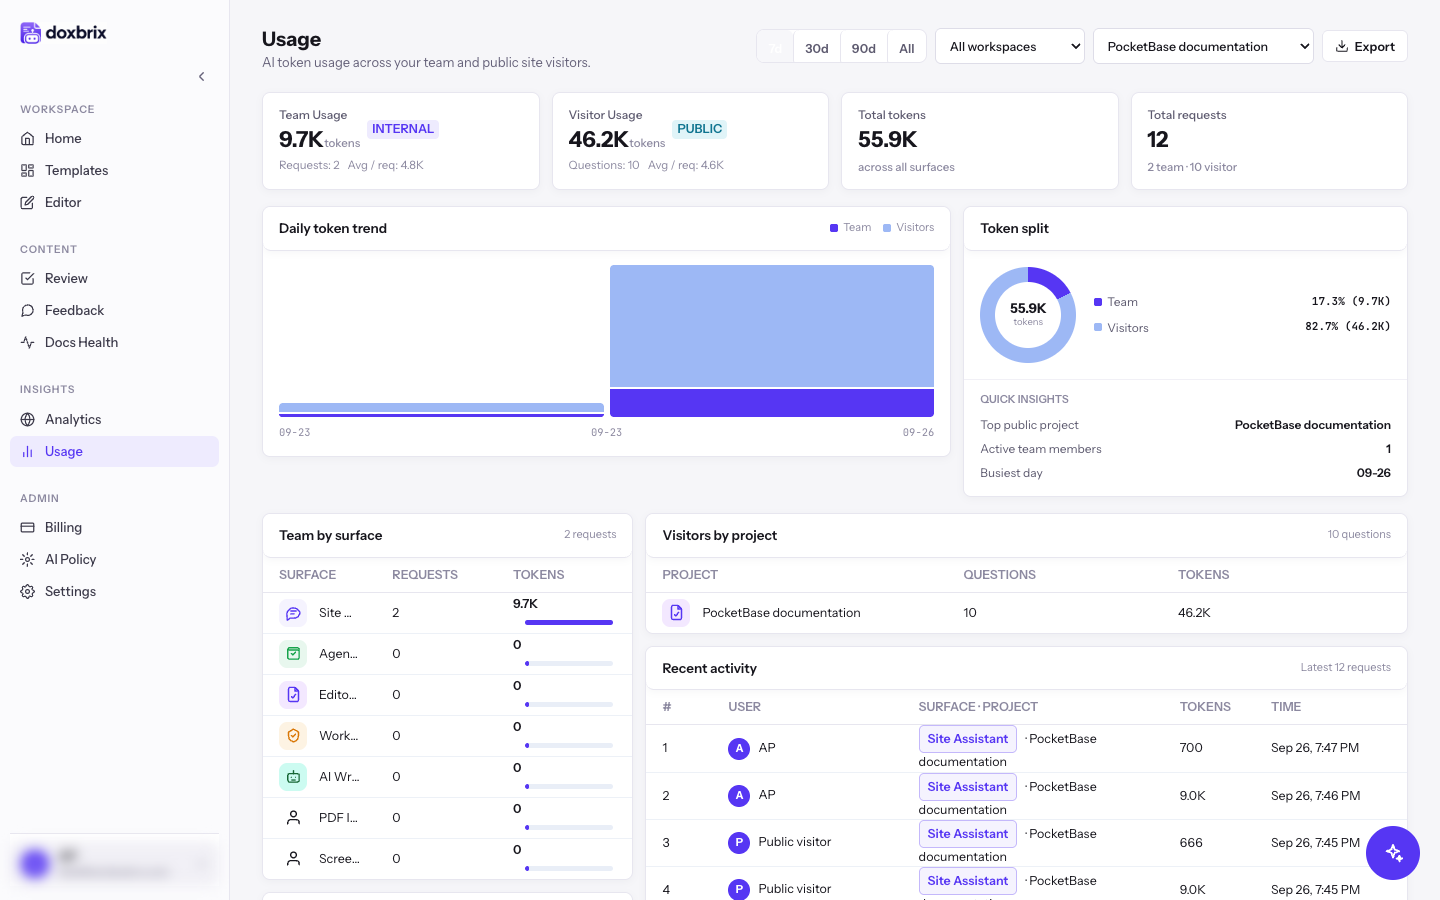
Scroll down to the breakdown panels:
- Team by surface shows team tokens per feature: Editor AI, AI Writer & Admin, Workspace Assistant, Agent Automation, Site Assistant, PDF Ingestion or Screenshot Capture.
- Top team members lists each Member with their Requests and Tokens.
- Visitors by project lists Questions and Tokens for each project.
- Recent activity lists the latest 12 requests with the User (a member name or Public visitor), Surface · Project, Tokens and Time.
Use these panels to find which feature, person or site is responsible for a spike on the Daily token trend chart.
Select Export to download the usage records for the current filters as a CSV file. The file is named after the range and the current date, for example ai-usage-7-2026-09-27.csv. Open it in a spreadsheet to share it or to build your own report.
Verify
- The selected range button, Workspace filter and Project filter show the scope you chose.
- Total tokens equals Team Usage plus Visitor Usage.
- Total requests shows the team and visitor split, for example 10 team · 12 visitor.